Display Options
Show charts by default
When a user opens this view, immediately show charts rather than data rows
Interface -> inline editing
The goal of this feature is to allow rapid and efficient editing of data when in the list view so there’s no need to drill down into a record to edit and back to the list again after each.
Some examples of where this might be useful would be when working through a list of milestones to update statuses, or when in a list of stock items to update quantities.
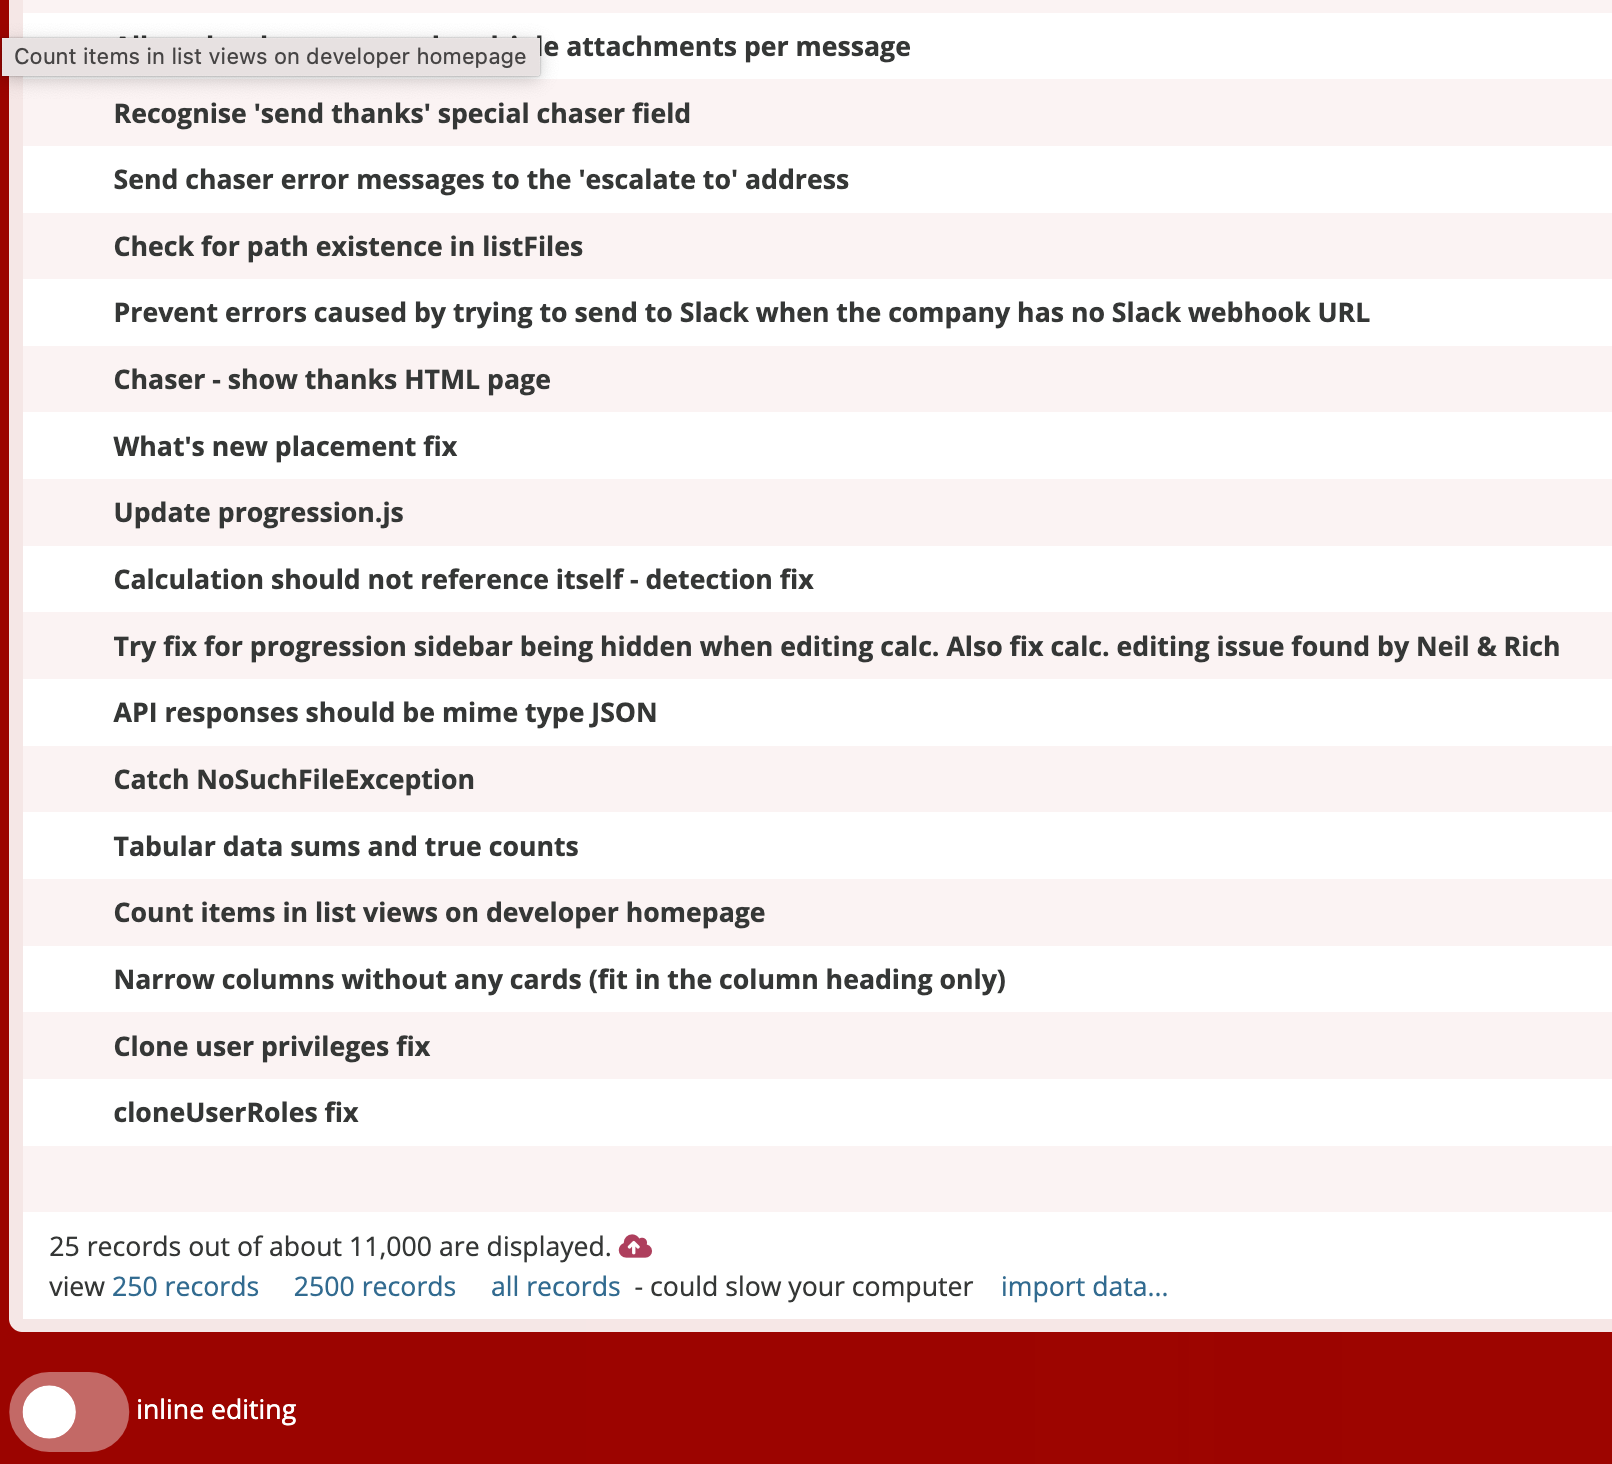
In inline editing mode, the list view changes from something like this:
into this editable version:
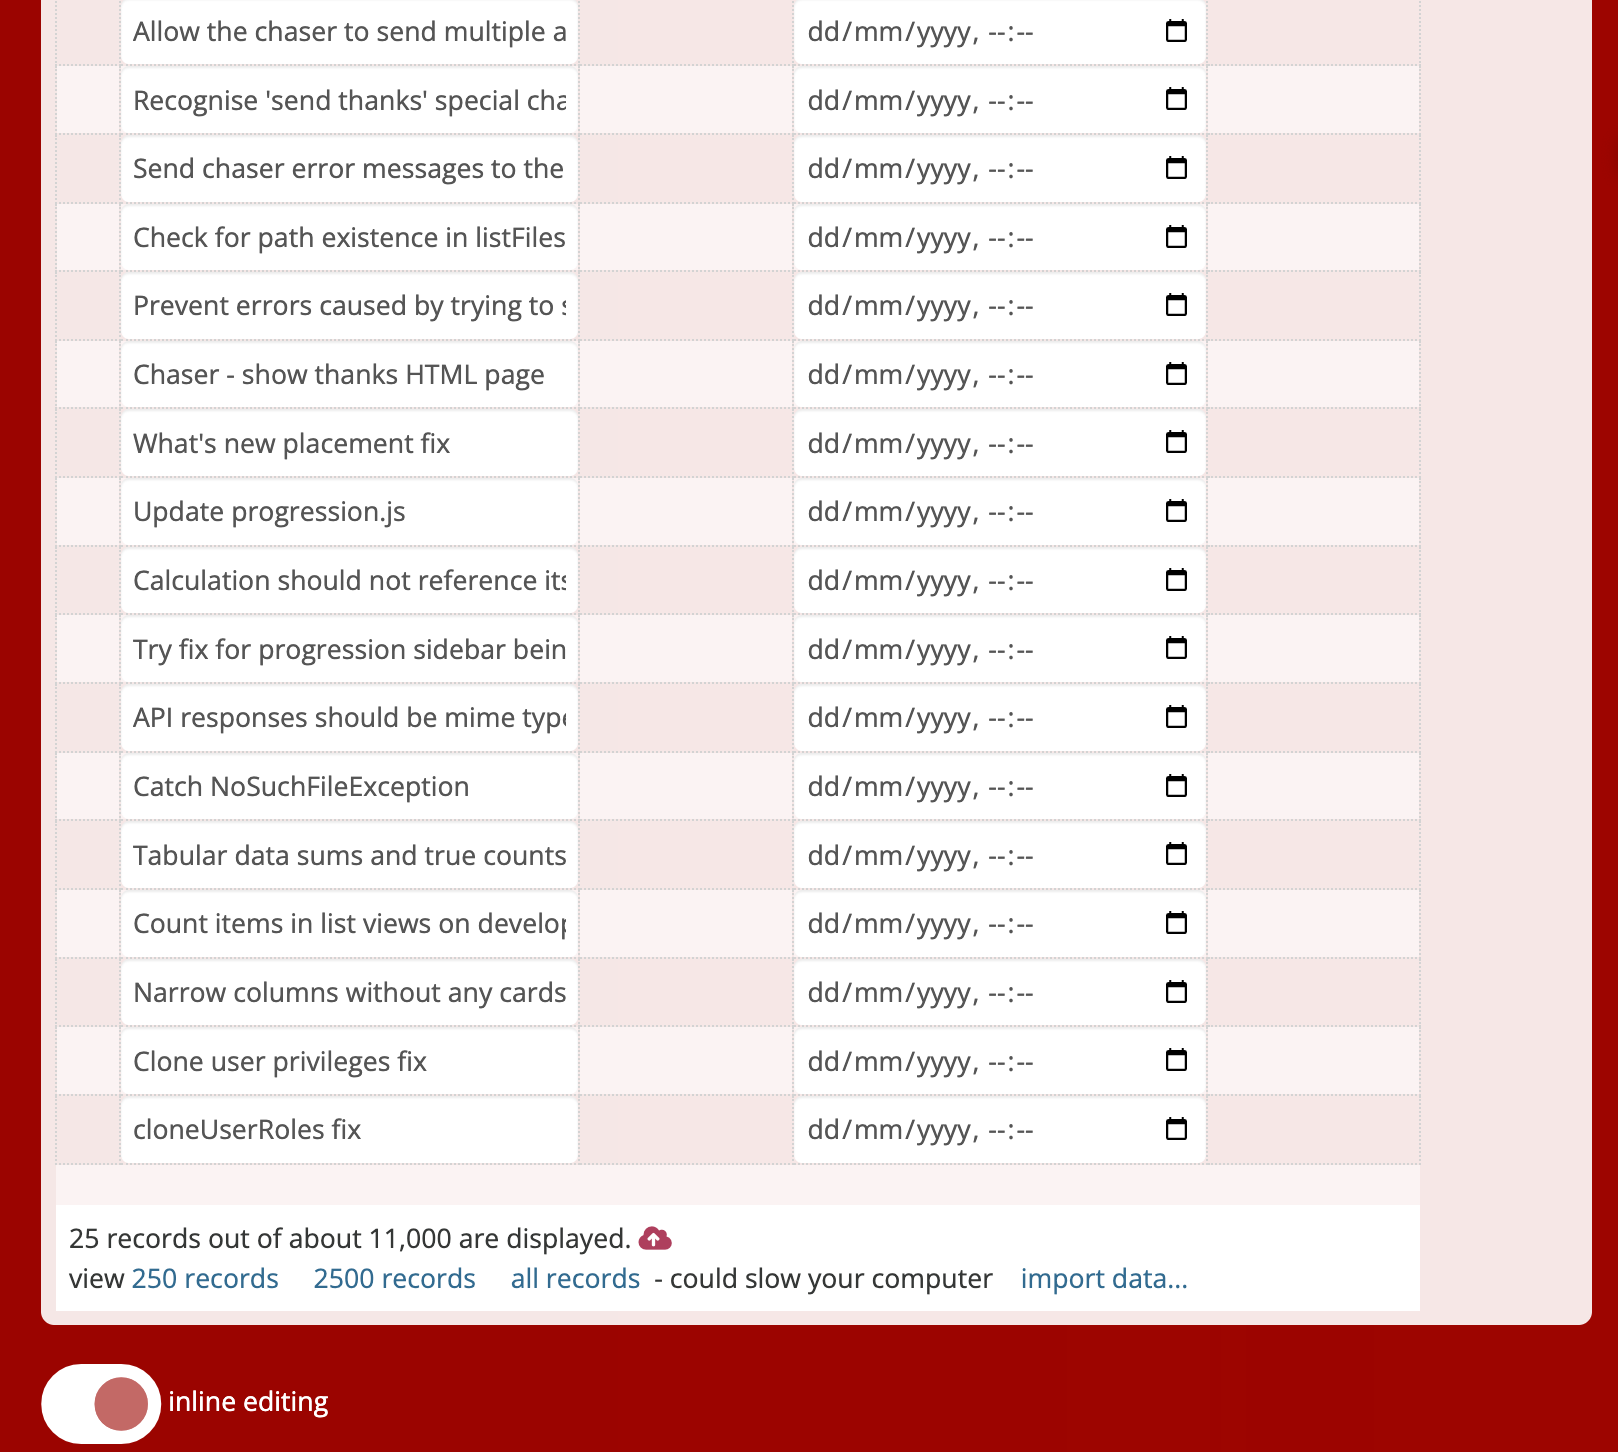
Certain fields will be editable, but others will be read-only.
Fields that can be editable are all those which are from the view’s parent table as well as the display fields of relations in that table.
For example, if editing a list of contacts, then the contact name, email, phone number etc. would be editable as well as the organisation name, if the contacts table had a relation field linking to the organisations table, which had organisation name as its display field.
Fields that will not be editable are
- calculations
- fields from other tables joined to the view, except relation display fields as above
The inline editing option has three states:
- Disallow: the view can’t be inline edited
- Allow but turn off by default
- On by default
Interface -> cards in columns
When cards in columns is selected, the display switches from showing each record as a row, to showing each as a card in a column.
The column names are generated from the first dropdown field in the view (there must be at least one dropdown field in the view for this to work).
Each available option in the dropdown becomes a column. Each record is placed, as a card, in the column which matches the dropdown value for that record.
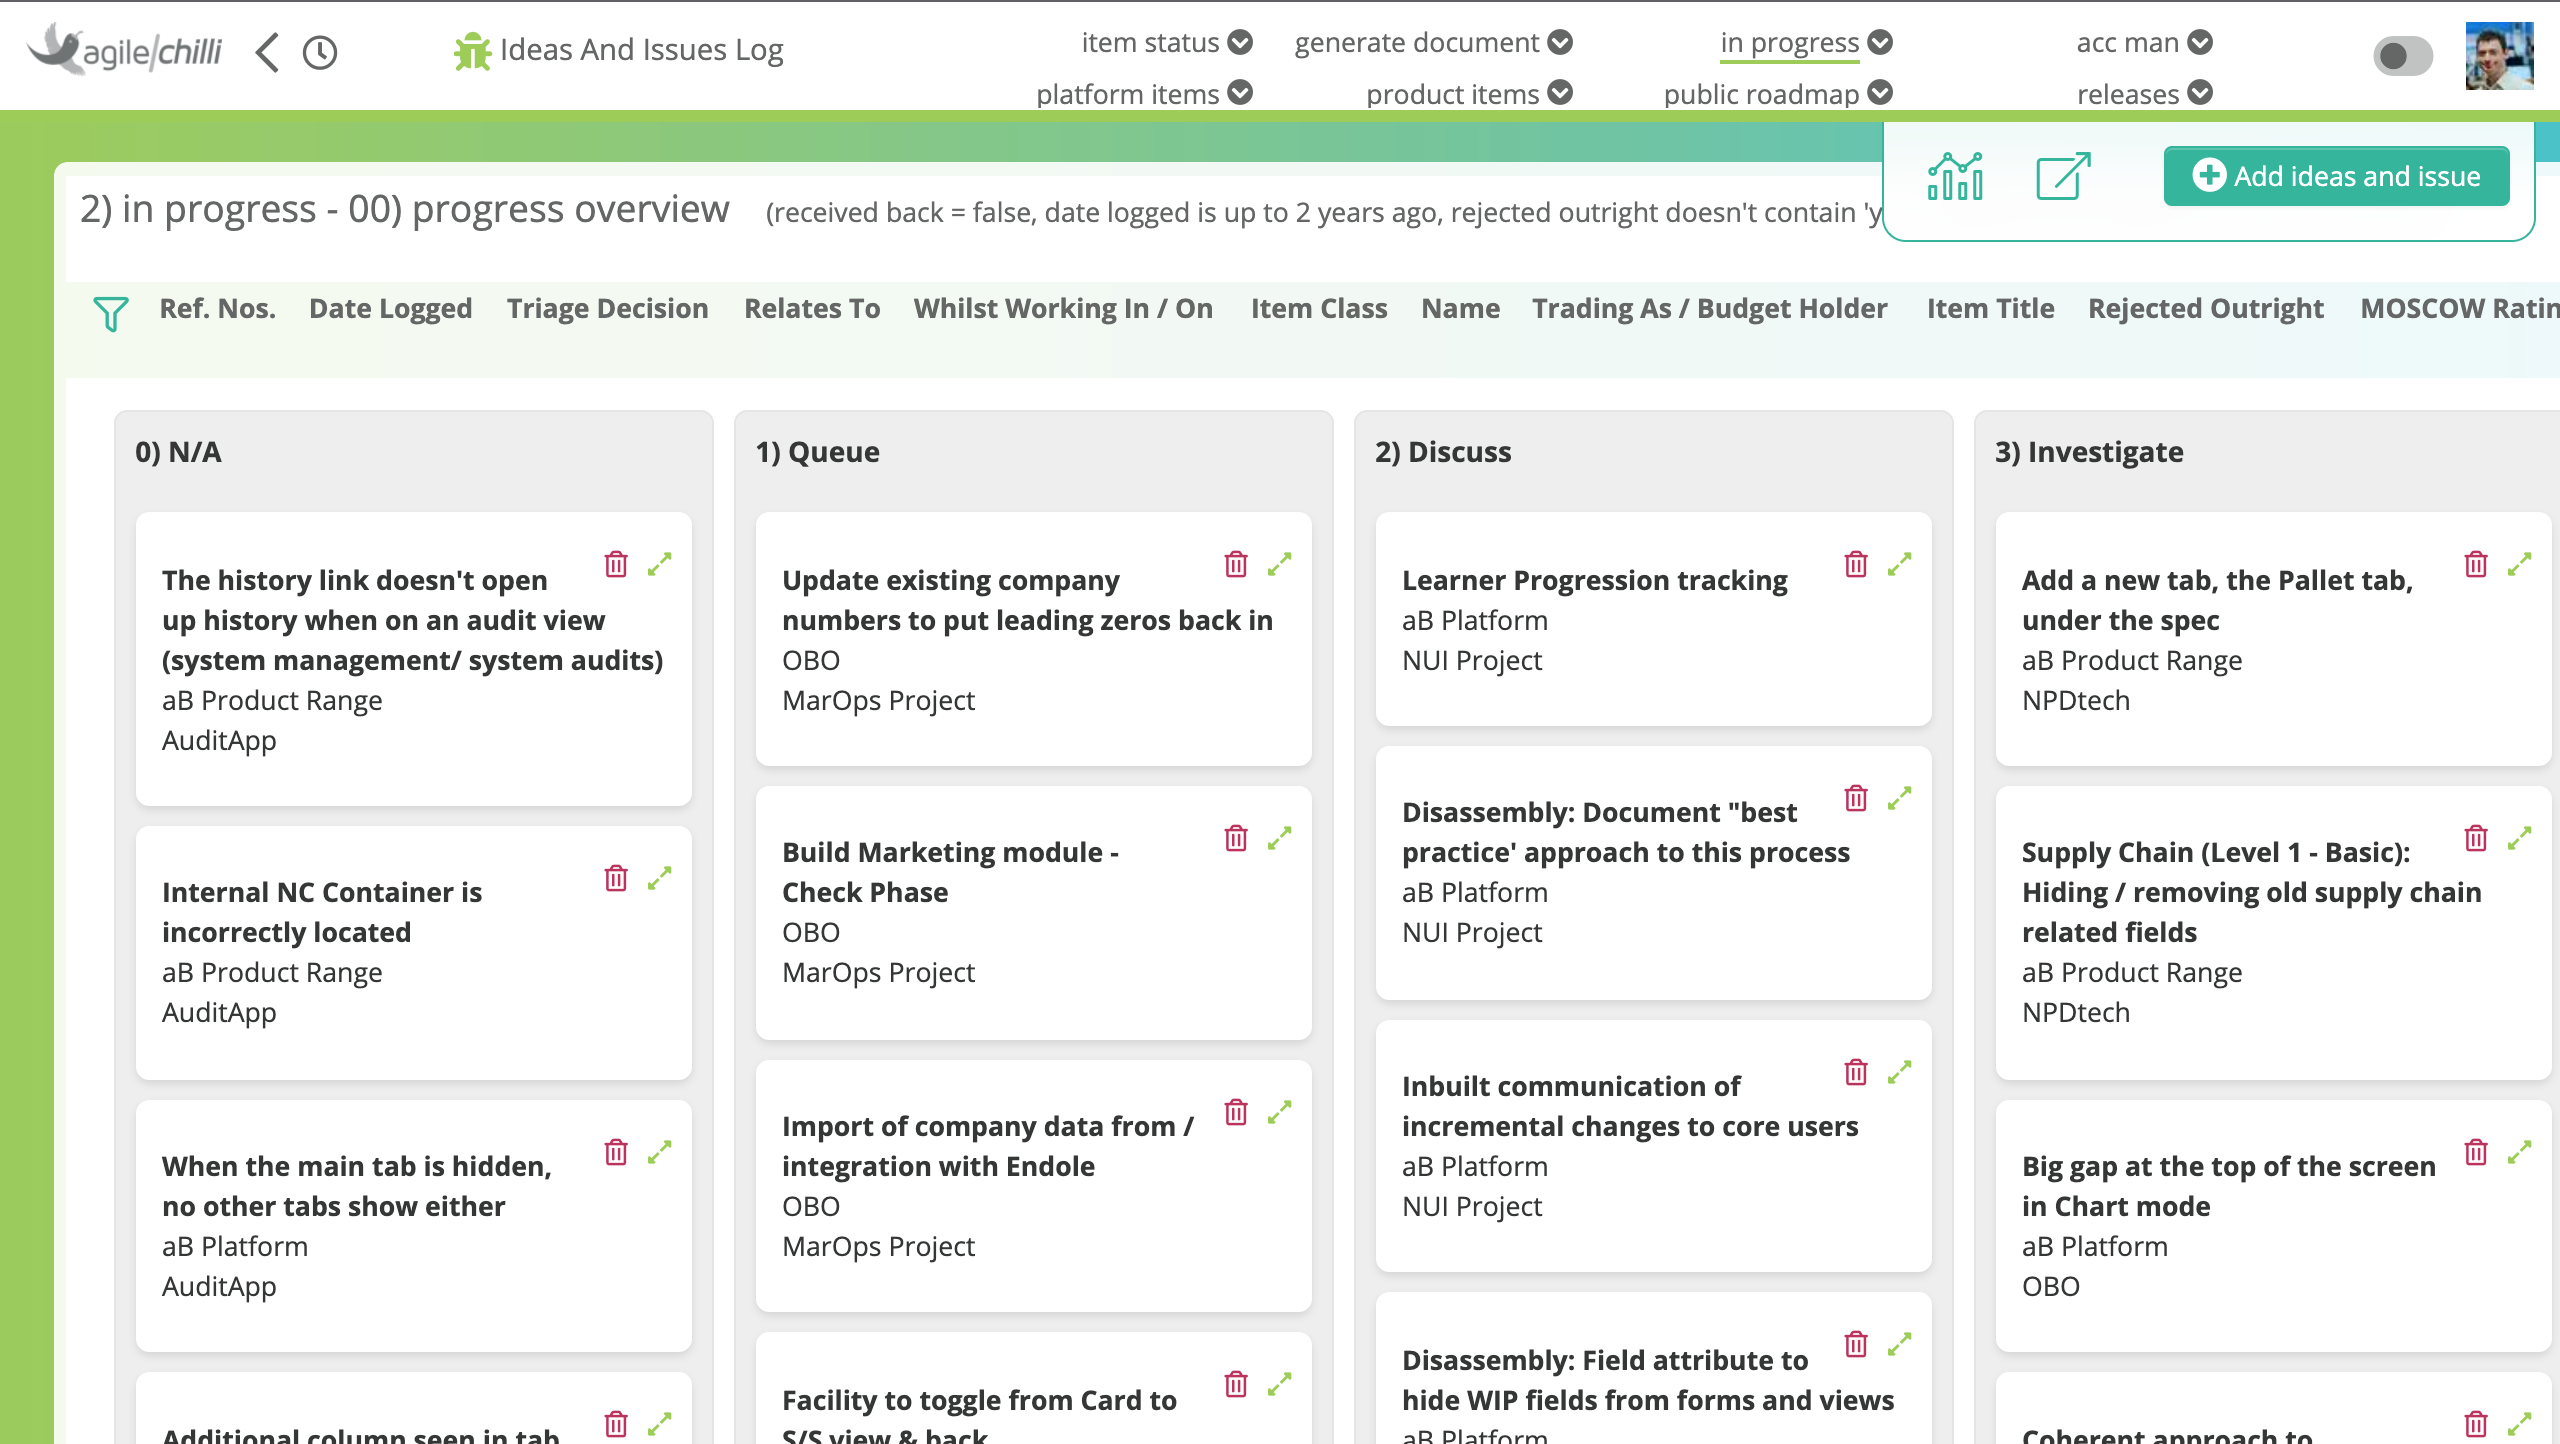
Dragging a card from one column to another updates that record, changing the value of the dropdown field to match the column.
Vertical grouping within a column
It’s also possible to sub-divide each column into groups. To achieve that, simply set up the available options in the dropdown to have prefixes separated by a dot.
E.g.
- 1.1) column one, group 1
- 1.2) column one, group 2
- 2.1) column two, group 1
- 2.2) column two, group 2
Then, cards can be dragged to different groups, not just different columns.
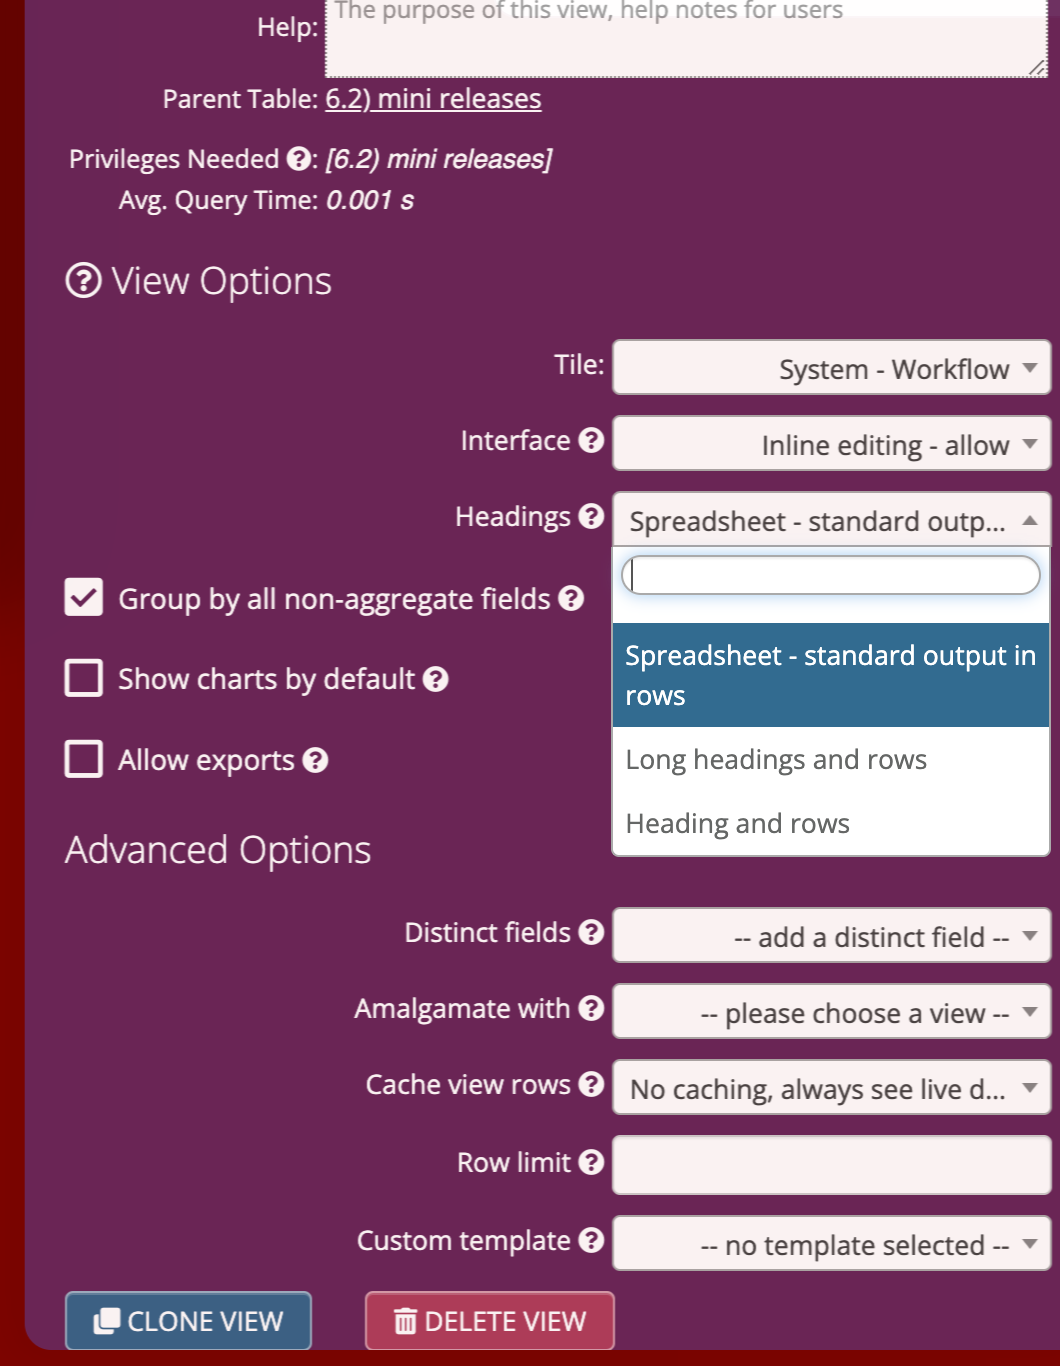
Style (layout options)
The visual style affects whether a list of rows is shown with headings or not. This is not used when the cards option above is active.
- spreadsheet format - standard output in rows (no headings, the default option)
- headings and rows
- long headings and rows
When headings and rows is selected, the first field in the view will be used as a heading for the rows below. A new heading appears every time the field value changes.
When long headings and rows is selected, an amalgamation of content from the first fields in the view that all belong to the view’s parent table will be used as a heading. As soon as a field is encountered that is from a different table, heading text generation stops. Calculations that are added to the view can also form part of a heading, as long as they are placed next to (before, after or within) that first set of fields from the view’s parent table.
For example, if the fields in a view of organisations and contacts are
- Organisation name (from the organisations table)
- Website address (from the organisations table)
- Contact Name (from the contacts table)
- Email address (from the contacts table)
then a heading would be generated consisting of organisation and website address. Each time a row where one of these is different is encountered, a new heading row will be shown.
Feedback
Was this page helpful?
Glad to hear it! Please tell us how we can improve.
Sorry to hear that. Please tell us how we can improve.