Performance Optimisation
Agilebase automatically takes some measures behind the scenes to maintain high performance as data volumes grow. And the underlying PostgreSQL database is pretty good at running queries very quickly.
As your system matures, you may find there are tweaks you can make to keep it running fast so that there’s a good user experience.
What can cause slowdowns?
If anything seems to be running a bit slow it will almost always be down to the performance of a view. Views can involve lots of data and complex calculations. Also lots of things depend on views, some examples (a non-exhaustive list):
- obviously opening a view itself in a tile and searching it
- opening a record can be affected if
- it has referenced fields embedded in it (to show charts or data for example)
- there are visibility rules on fields (which depend on views)
- a workflow view is set to run every time a record is opened
- showing charts (which get their data from views)
- making a call to an API view
A fuller list can be seen at view special uses.
Examining performance
Agilebase gives you some tools to enable you to see where performance issues might be surfacing:
Performance suggestions may be shown on the development homepage, when you first toggle it on.
Views
Also on the development homepage, the list of ‘all views’ has three columns of interest:
- popularity (calls per day)
- query seconds
- load factor (popularity x query seconds)
Sorting by query seconds (click on the column heading, then click again to sort descending) will show you a list of the slowest views in absolute terms. If a view takes 10 seconds to load, you will probably want to speed it up.
If it’s a popular view, i.e. there are people looking at it all the time, then doubly so. The third column load factor (popularity x query seconds) gives you an easy way to look at those factors together.
Tables
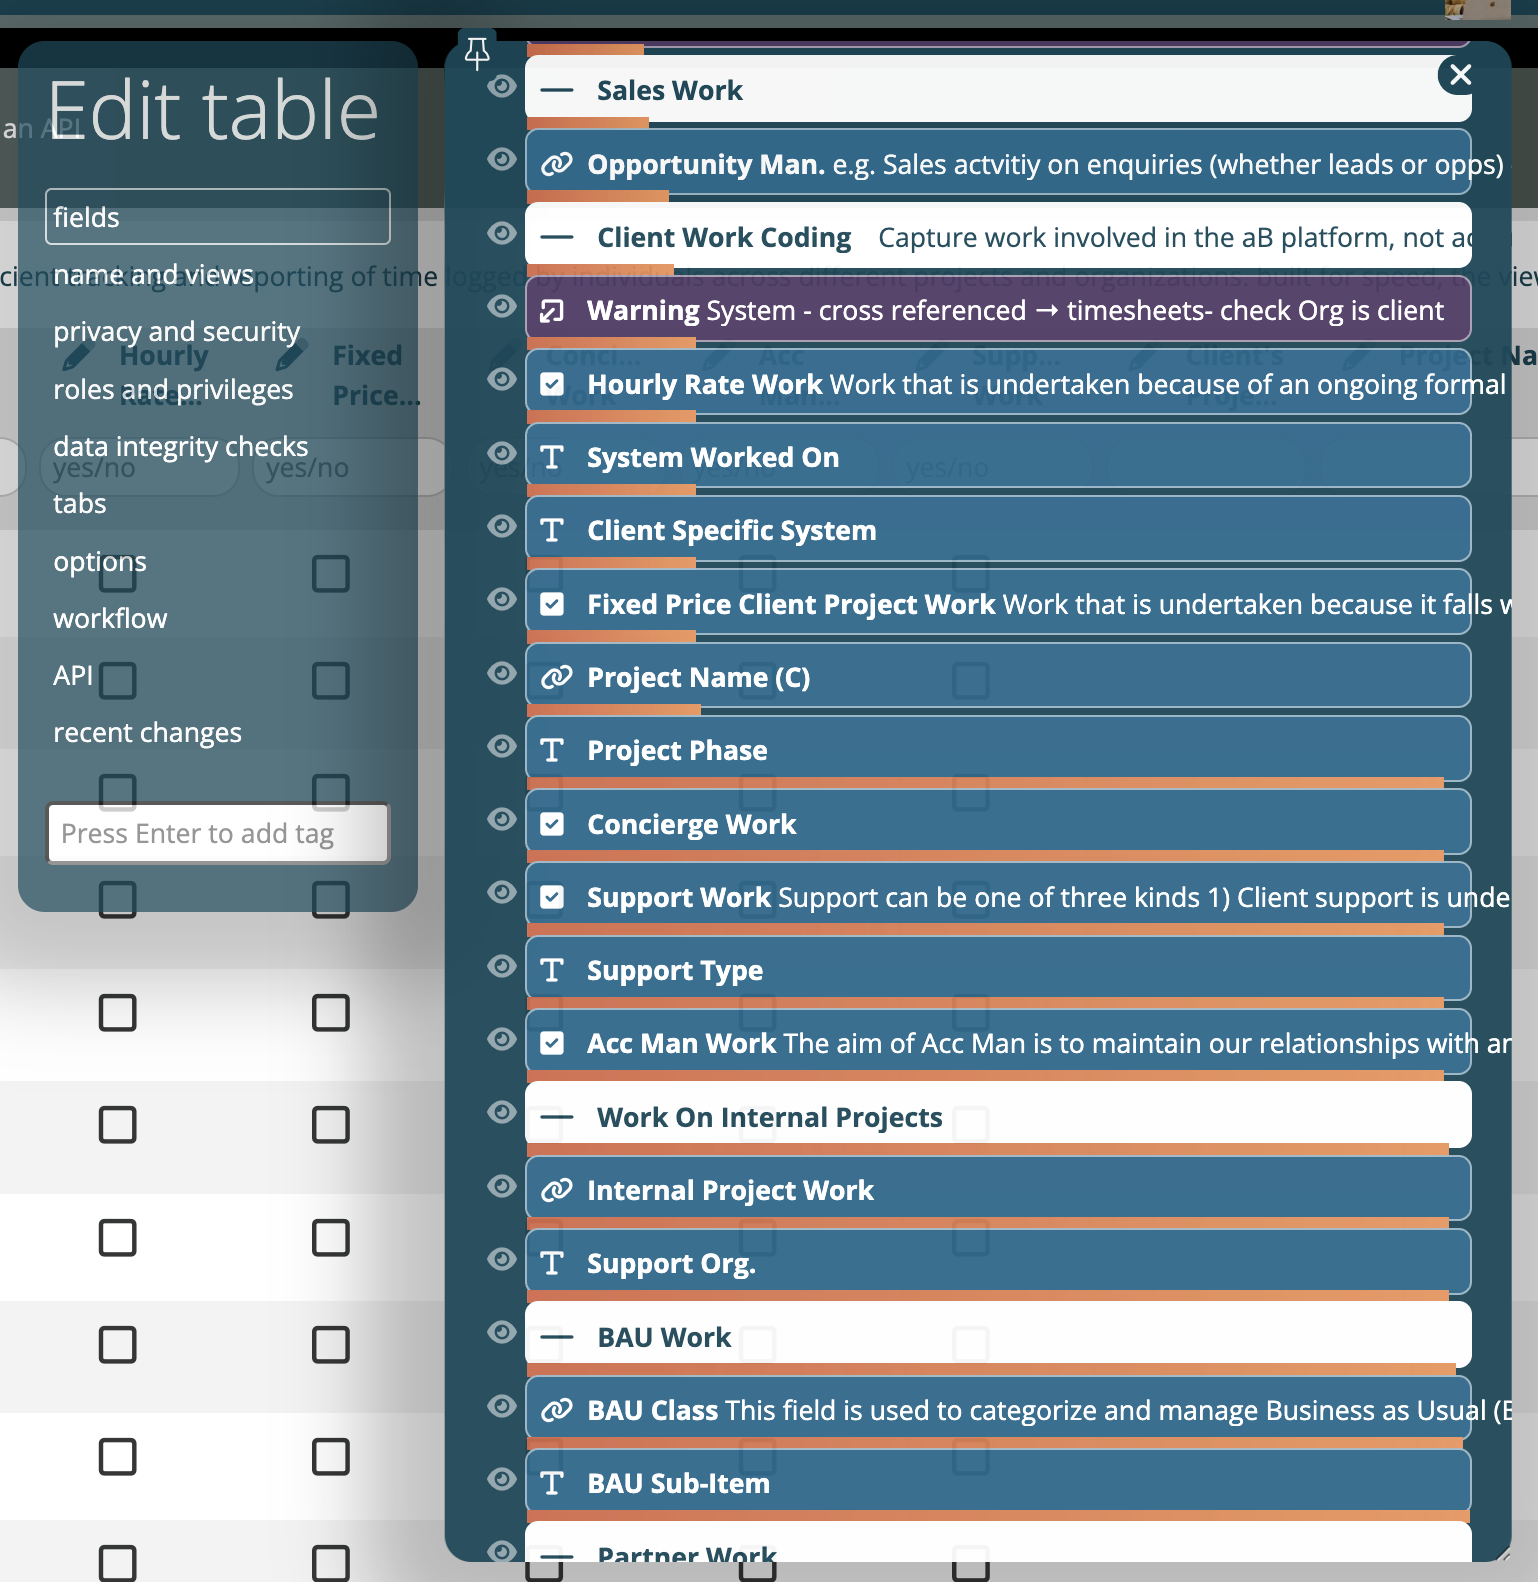
If records from a table are taking significant time to open, then a breakdown of what is causing the slowdown will be displayed on screen in the list of fields as you’re editing the table. Orange bars will show how much each field is contributing to the slowness, cumulatively (to reach 100% at the bottom of the list).
In this example, you can see that the field Project Phase is the main contributor. Since it has a visibility view (denoted by the eye symbol), that is probably the cause. You can drill into the detials by clicking on the view.

Note that if a table has the Run this workflow whenever each record is viewed option, the speed of the workflow view(s) used can also contribute to loading time.
Speeding things up
There are a number of ways that view performance can be optimised.
Show only the data necessary
The simplest starting point is to ensure that only the data necessary for the intended task is included in the view. That goes for both roles and columns.
So for example, with a list of opportunities for salespeople to work, you probably only need the live enquiries, not the closed ones. If you do want a view of all historical records, you can of course create a second one for that purpose. Also, limit the fields displayed to only those which are necessary.
Look at joined views
The same thing goes for the joined views. If for example you have a joined view which calculates the distance in miles or km to each company in the above opportunities list above, ensure that view itself only calculates data for the live opportinities.
There’s a bit of a trade-off with practicality here sometimes. You may have a view of distances to different companies which serves lots of different other views, so may not want to create a different one for each list the data’s used in.. However for particularly problematic views you may want to consider it.
Query plan selection
" Agilebase will automatically compare different plans and suggest the best one, but that can change over time. To verify it yourself, use the query plan option.
Caching
For a complete discussion of what caching is and when it works, please see the cache view rows option.
Using a tool to examine the query plan
Postgresql can generate very detailed information detailing exactly what it’s doing under the hood to generate the query results.
To show this, double click anywhere in the properties and options panel when editing a view. Scroll down to the view definition which appears and press the EXPLAIN button.
The ’explain’ output will then appear and can be copied and pasted. To interpret it and get some suggestions, it’s easiest to paste it into a tool such as
or
Be careful about privacy and security - some tools make your content public by default, you may wish to disable that.
Adding indexes
This is something we will need to do for you, but if you have filtered a view down to the minimum number of rows and it hasn’t speeded up, it may help. Please contact us.
For really big data projects, there’s also the option of utilising PostgreSQL-compatible database services designed for such tasks, like Citus Data, which we will be happy to provision.
Feedback
Was this page helpful?
Glad to hear it! Please tell us how we can improve.
Sorry to hear that. Please tell us how we can improve.