Examining Performance
Performance suggestions
Performance suggestions may be shown on the development homepage, when you first toggle it on.
They are organised into categories:
- Cacheable views - the system automatically determines when caching particular views would be beneficial, based on many factors. For more information, please see the cache view rows view option.
The system will also highlight any cached views which maybe shouldn’t be. Views which have millions of rows will have a large caching overhead for example
- High load views - these are views which are very often used and also slow, the combination of both means they put a high load on the system and affect performance generally
- Slow views - these are the slowest views in the system, measured by loading speed, users may benefit if you can speed them up.
Views list
Also on the development homepage, the list of ‘all views’ has three columns of interest:
- popularity (calls per day)
- query seconds
- load factor (popularity x query seconds)
Sorting by query seconds (click on the column heading, then click again to sort descending) will show you a list of the slowest views in absolute terms. If a view takes 10 seconds to load, you will probably want to speed it up.
If it’s a popular view, i.e. there are people looking at it all the time, then doubly so. The third column load factor (popularity x query seconds) gives you an easy way to look at those factors together.
Note that if a table has the Run this workflow whenever each record is viewed option, the speed of the workflow view(s) used can also contribute to loading time.
Using a tool to examine the query plan
Postgresql can generate very detailed information detailing exactly what it’s doing under the hood to generate the query results.
To show this, double click anywhere in the properties and options panel when editing a view. Scroll down to the view definition which appears and press the EXPLAIN button.
The ’explain’ output will then appear and can be copied and pasted. To interpret it and get some suggestions, it’s easiest to paste it into a tool such as
or
Be careful about privacy and security - some tools make your content public by default, you may wish to disable that.
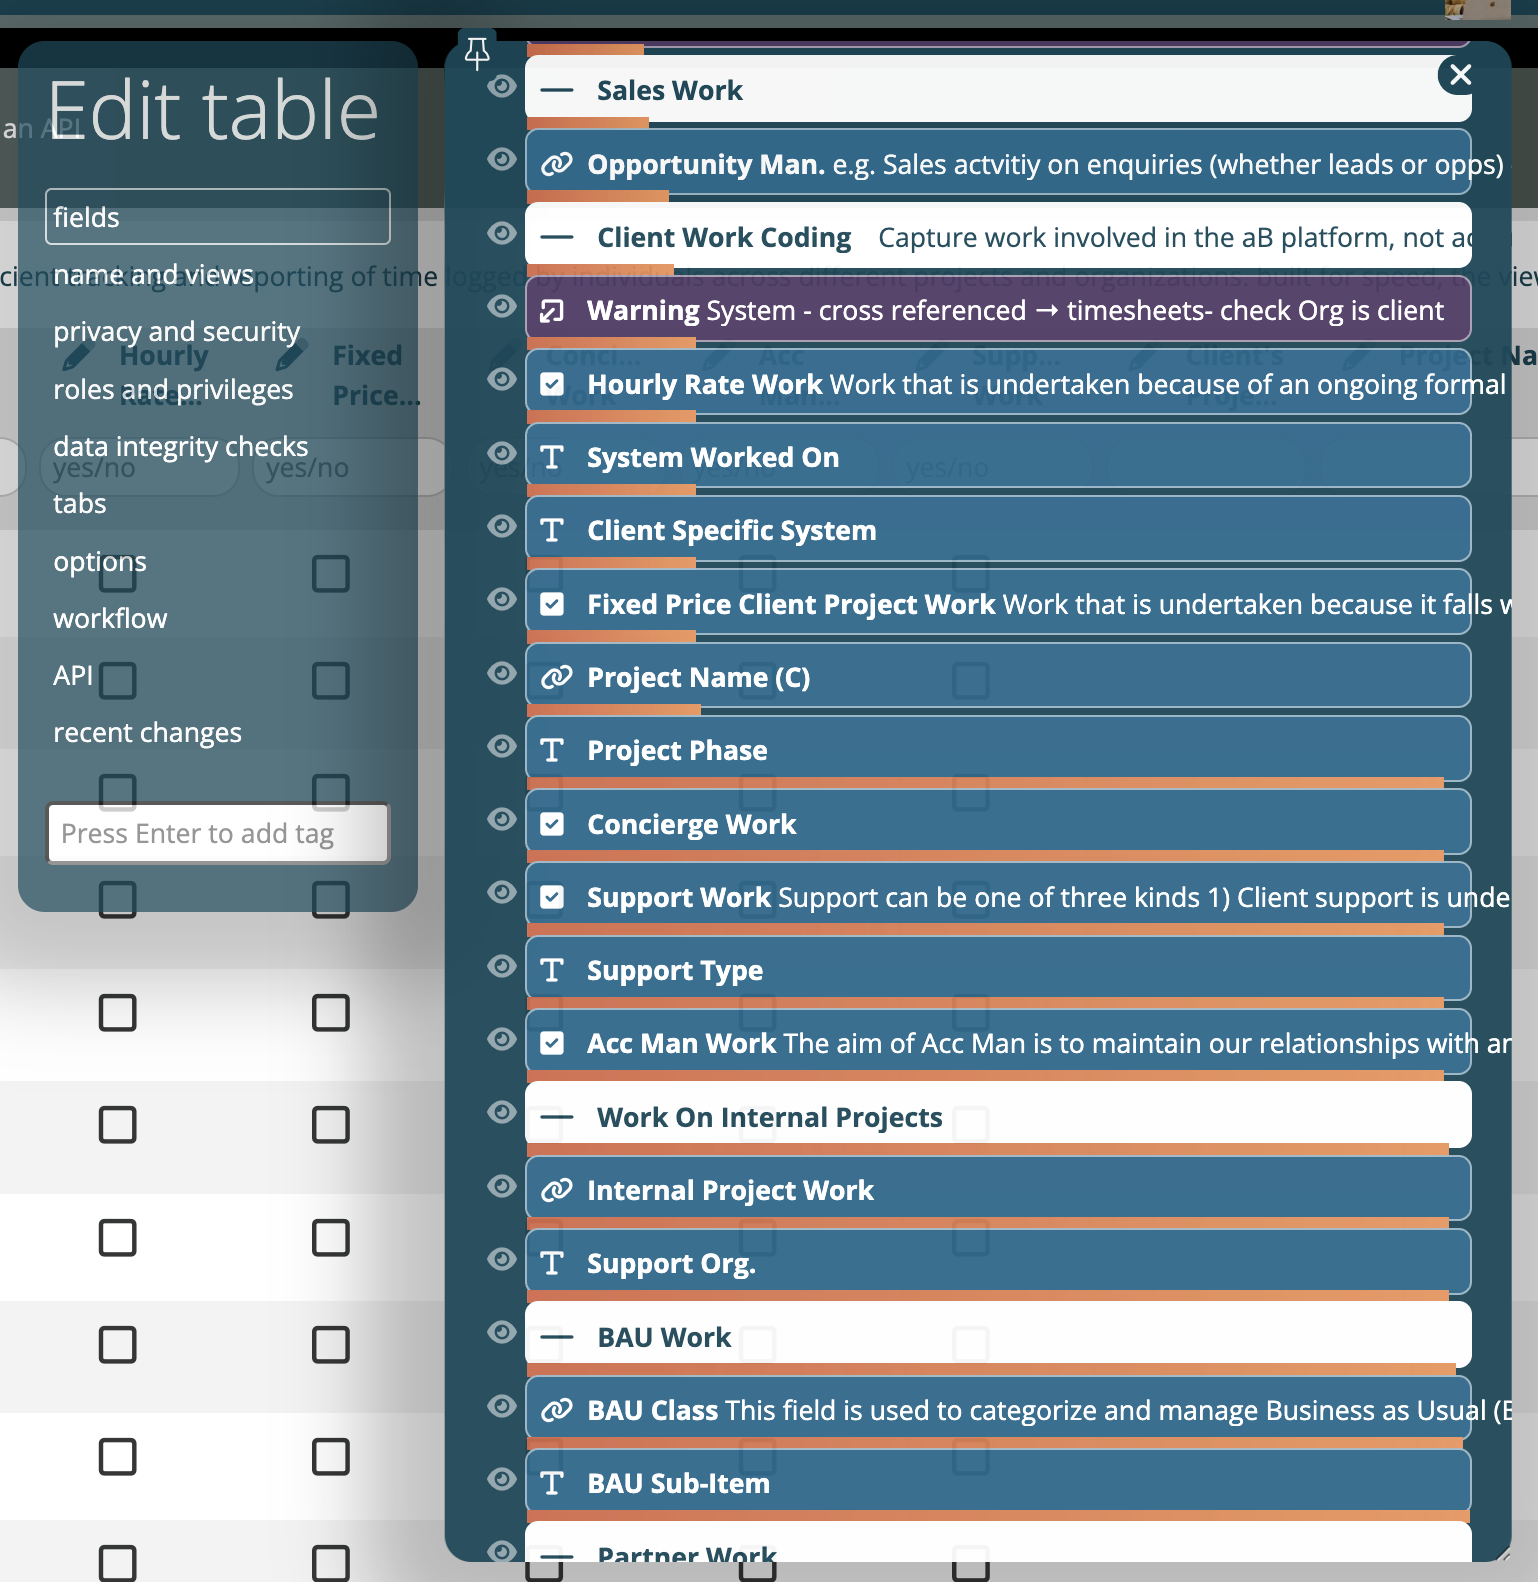
Tables
If records from a table are taking significant time to open, then a breakdown of what is causing the slowdown will be displayed on screen in the list of fields as you’re editing the table. Orange bars will show how much each field is contributing to the slowness, cumulatively (to reach 100% at the bottom of the list).
In this example, you can see that the field Project Phase is the main contributor. Since it has a visibility view (denoted by the eye symbol), that is probably the cause. You can drill into the details by clicking on the field.
Feedback
Was this page helpful?
Glad to hear it! Please tell us how we can improve.
Sorry to hear that. Please tell us how we can improve.