PULL API worked example - Power BI
agileBase has built in charting which is great for quickly analysing and answering questions about data in your system, but specialist business intelligence apps can be particularly useful if you want to join data from multiple sources (perhaps an accounting package or marketing automation system too) in one place.

Setting up
The below may look like lots of steps but that’s just because we’ve split it up into very small, simple parts to make it as easy as possible to follow.
Step 1: set up a view in agileBase to use as a data source
Use a view bringing in as many possible variables into one place. For example, if you want to analyse sales, you might include totals by customer, product, salesperson, region, category, price banding and date. That way you have plenty of dimensions to analyse in multiple ways later on.
Step 2: turn on the API for the view to make data available
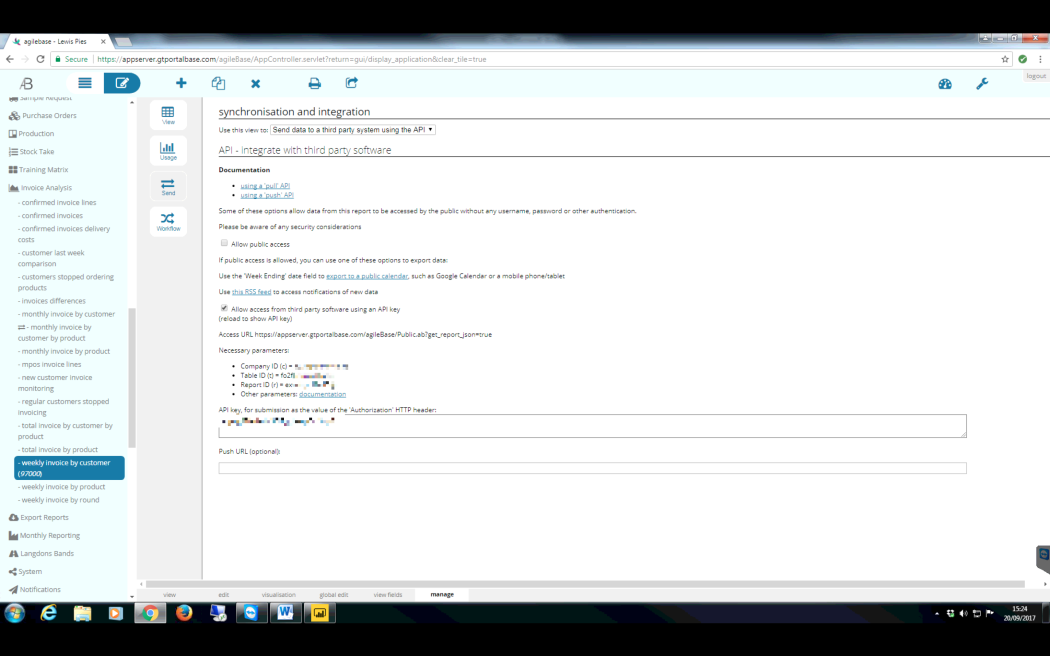
In the view’s manage tab, select the send panel.
Select send data to a third party system using the API in the dropdown list and make sure you tick allow access from third party software using an API key.
Refresh the view to show your API key needed for the next step.
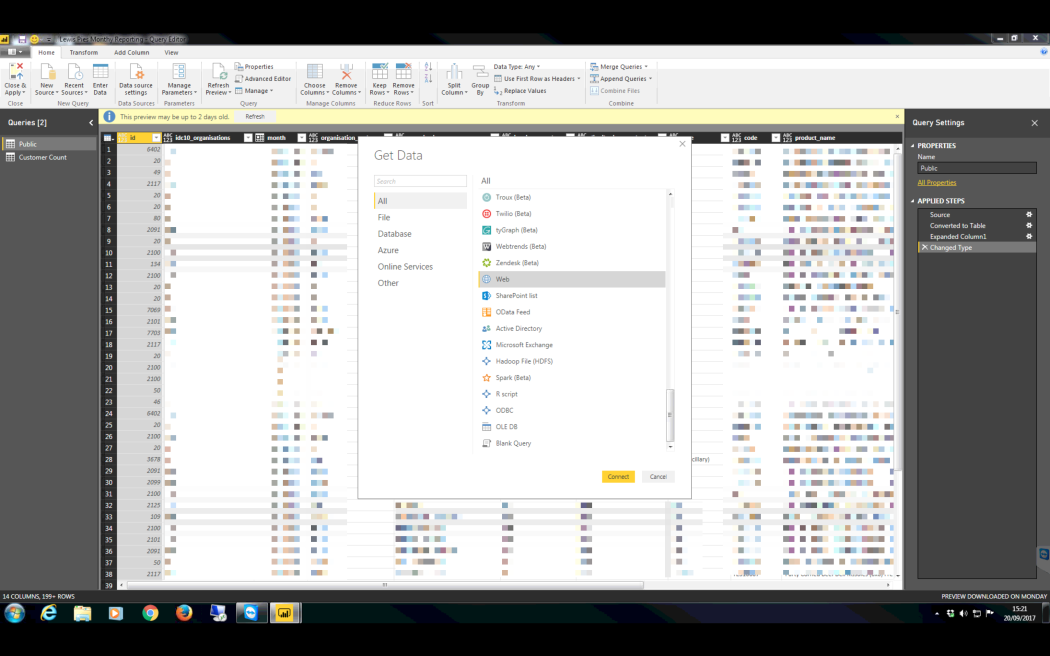
Step 3: within Power BI press get data and select Web as the data source.
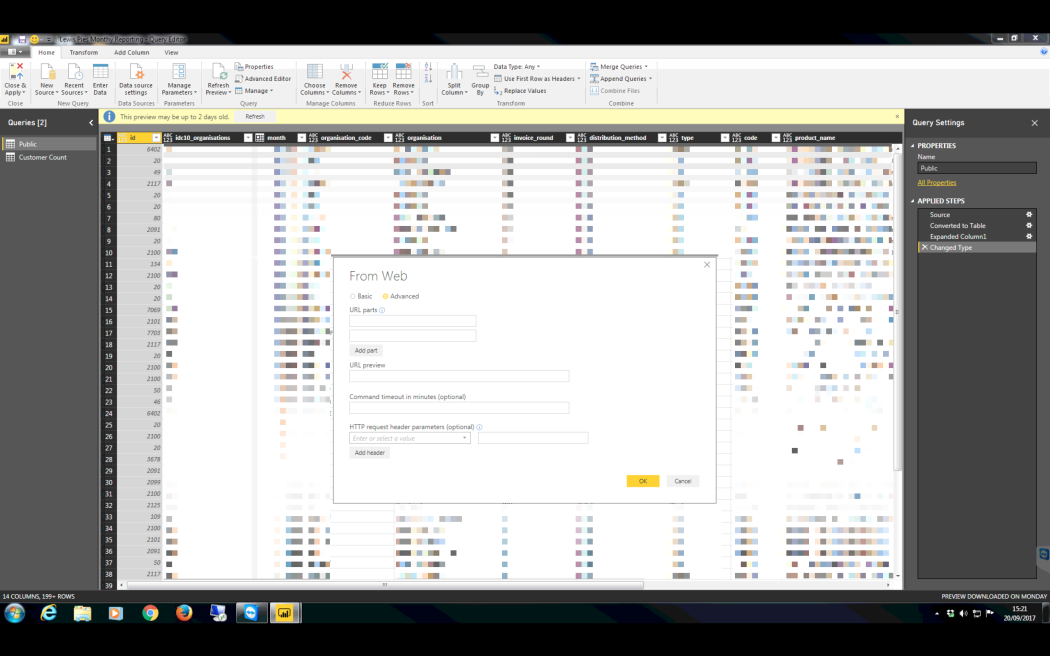
Step 4: enter the sync details provided by AB into Power BI
Select the advanced option and fill in the following URL parts provided from the AB view setup in the first point. These are the parameters to add:
?get_report_json=true
&c=[your ‘c’ value here from AB]
&t=[your ‘t’ value here from AB]
&r=[your ‘r’ value here from AB]
&json_format=json
&simple_format=true
&row_limit=100000 [or however many rows you need]
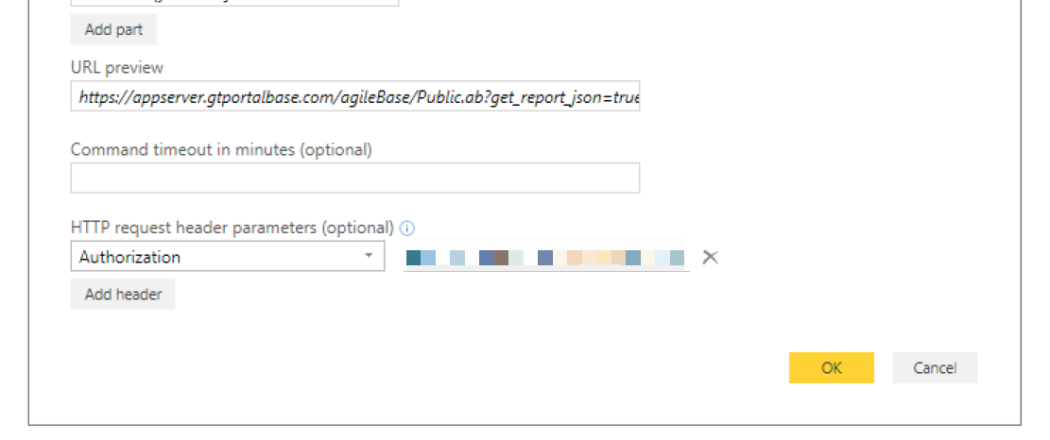
Step 5: enter the authorisation key into Power BI
Select authorization from the dropdown options under ‘HTTP request hear parameters (optional)’ and press OK. The authorisation key is provided in the agileBase view.
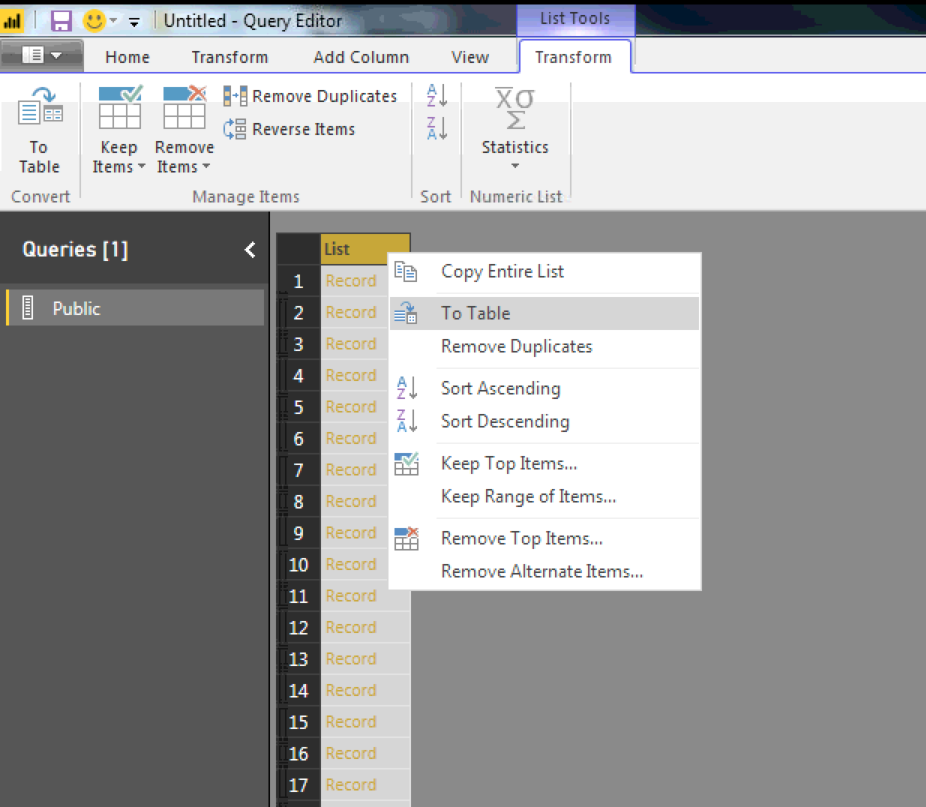
Step 6: make data visible in Power BI
Once the data has pulled through and the connection is set up you will need to convert the dataset into a table.
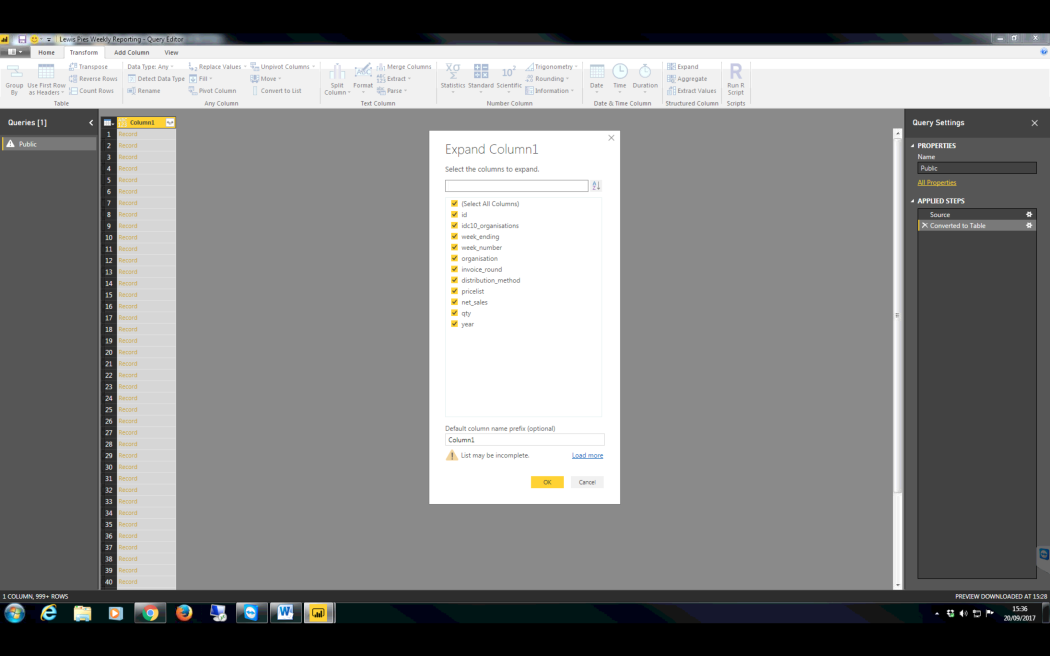
Step 7: expand the colums
Once converted to a table you will then need to expand the data into columns and your view will be presented to manipulate.
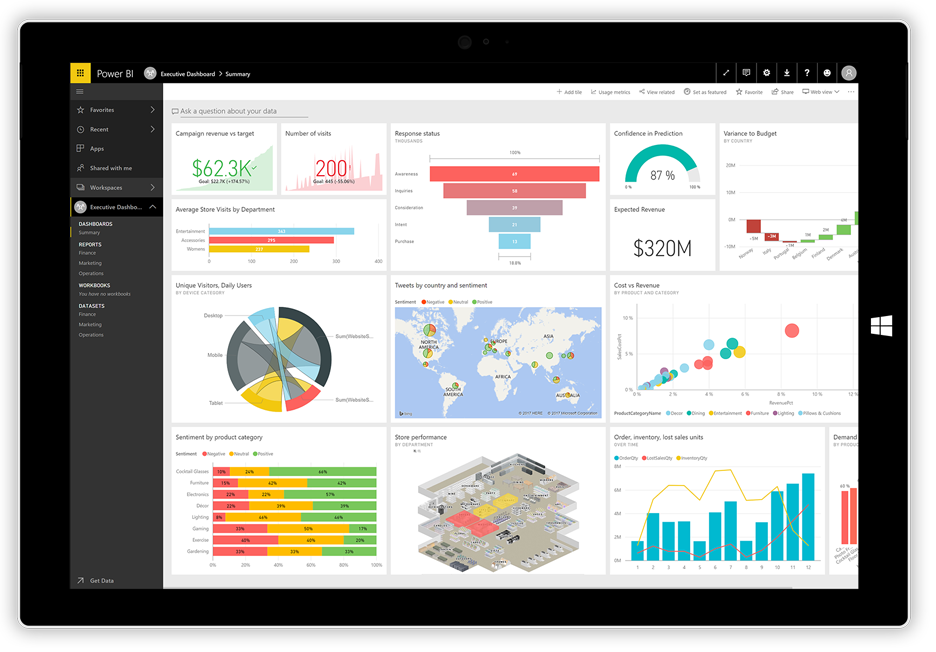
Step 8: create your visualisations!
Feedback
Was this page helpful?
Glad to hear it! Please tell us how we can improve.
Sorry to hear that. Please tell us how we can improve.