Guide 3.2 - Views: Advanced UI Control
Views
There are several videos and help pages you can find about creating views. We are going to concentrate on the parts that affect how the user interacts with them. Let us start with an important concept… Your views name, and how a naming convention affects the menu. (video coming soon} Start by giving your view a simple name, you can see it is listed under a menu title that is the name of the tile.
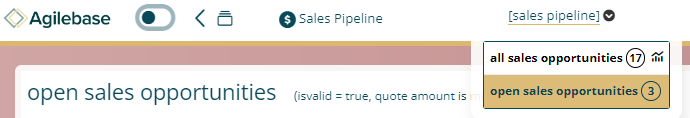
If you change the name and use a hyphen, the system will detect the hyphen and use the initial part as the menu group. This is a useful way of grouping views together. You can go further and use a number prefix after the hyphen to control the order of the views within the menu. This is often a vital step when building a system that takes a user through a step by step process.
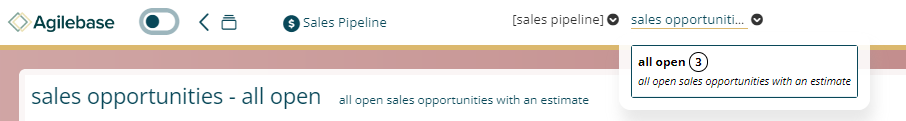
Don’t forget to provide your user with a description for the view…. it provides the first level of user help.
You’ll notice that when you provide a description it will replace the system-created description. This auto-generated description is based on the filters you have set… “isValid = true, quote amount greater than zero” won’t make much sense to your users. Wouldn’t you much rather read something like “All Open Sales Opportunities with an estimate” ?
View Interface Options
There are 3 options… Standard, Inline editing and Kanban
“Standard” provides the classic Table of data view of your records. However, you may wish to additionally allow your users to edit data “inline” - i.e. without requiring them to navigate through to the full record. If so, you have two options, either allowing them to toggle the inline edit mode on, or to have it on by default.
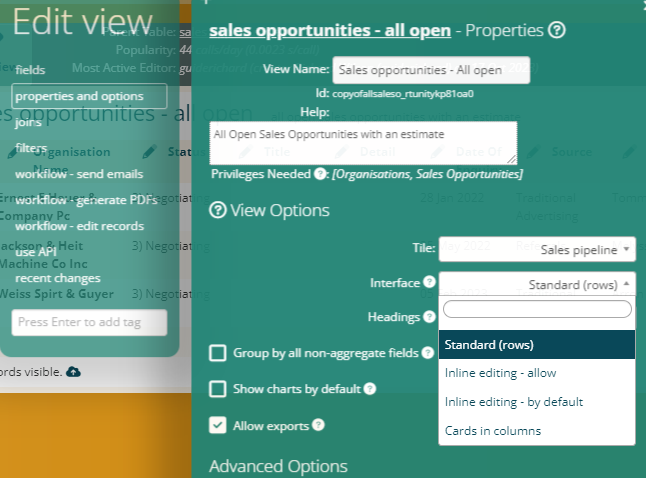
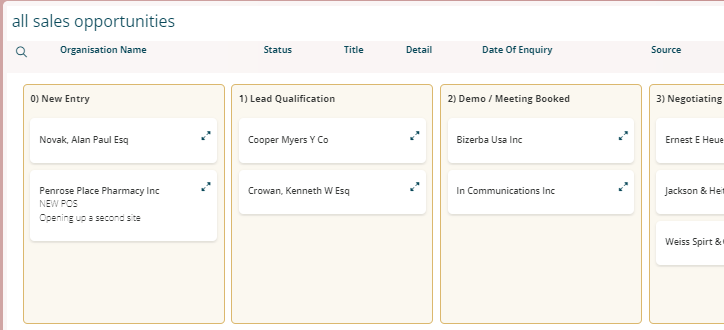
Finally, you can also enable the “Cards in Column” interface view (some people may know it as Kanban.)
This option will show mini cards for each record, stacked in to columns based on the first field that is a “use only given values” Drop Down. By using drag and drop, the user is changing the value of this drop down field. The first few fields in your view will be used in the summary view.
For the Tabular list of records you have the further option of how to control the “headings”.
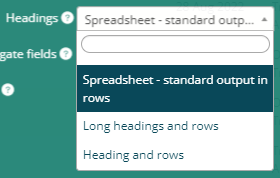
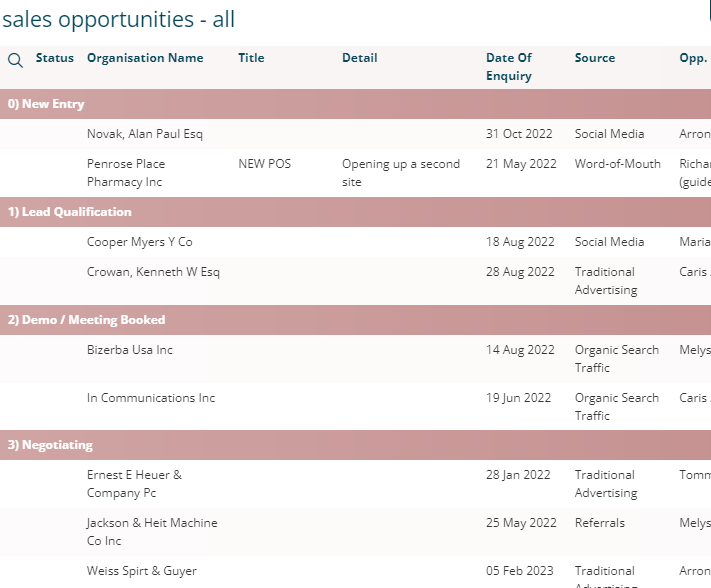
Spreadsheet is as it sounds with a column heading per row.
Headings and rows will group records by the first value.
Long headings and rows will group by the first “few” values that are from the same source.
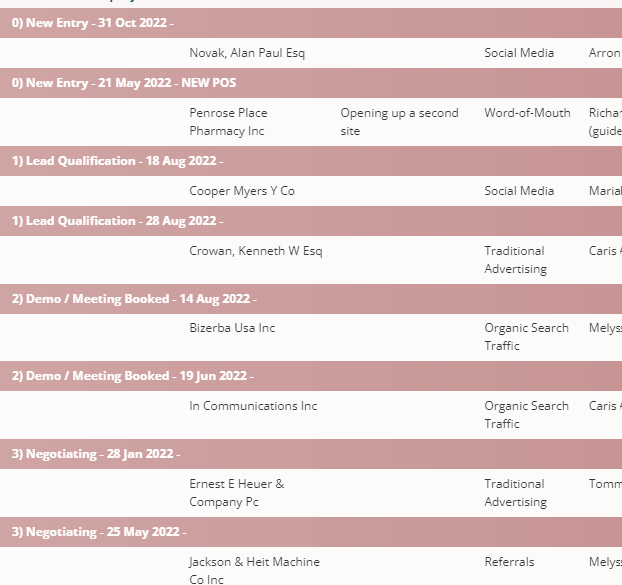
Obviously these last two options are for when you want to group together data…. This typically occurs when records share a similar value. This will naturally occur when displaying Parent Child data (e.g. Organisations list of contacts) but equally when records share a finite list of options (e.g. Contacts by source).
(video coming soon}
Adding a Button to a view
A useful feature in agileBase is to provide a button on a view that your user can press that will fire a WorkFlow that performs a function appropriate to the views content.
Example 1: your view shows a list of Food Samples that are to be created Today. The button at the top could fire a WorkFlow that generates the PDF of labels for use in sending out the resulting samples!
Example 2: your view shows a list of customer orders for delivery today. The button placed at the top of the view fires a workflow that updates the list and places the orders in a suggested sequence order for the delivery driver to follow.
To add a button to a view follow the following steps: Edit the view used by the User… goto workflow edit records. Do NOT set an action, instead simply set “Log update to” to be an appropriate field and leave “Frequency” on manual only. Set the “Next: when this workflow finishes, also run” to be the Work Flow you wish to appear at the top. Obviously this needs to be a fully functional workflow.
{video coming soon}
Graphs
Visit this page to find out more about how to add graphs to a view
Just a quick note about how graphs affect the views user interface…
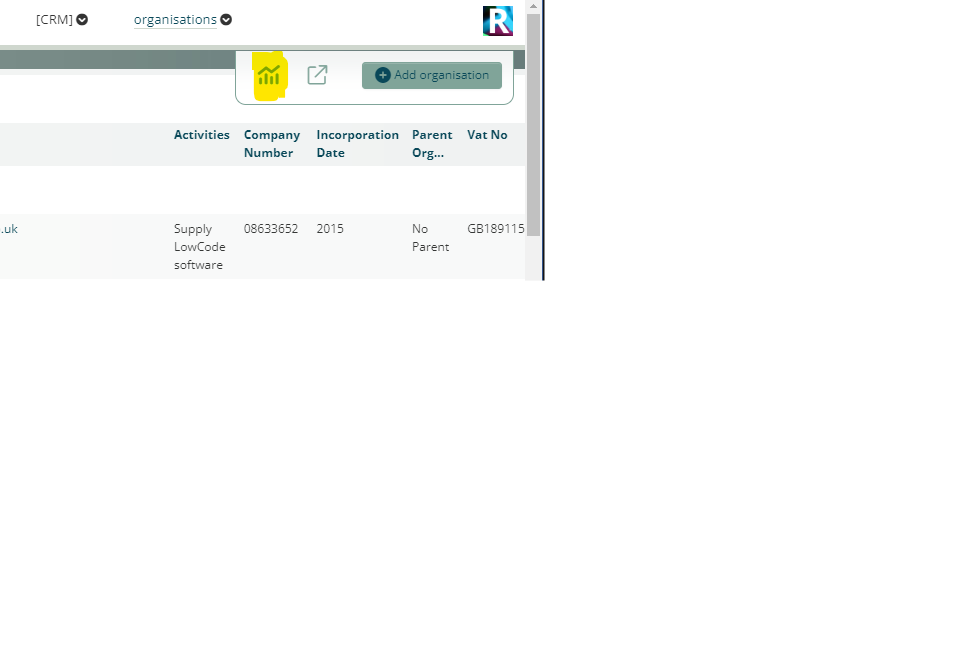
The drop down list of views will use a little graph icon next to to a view that contains a graph
![]()
The view is toggled between showing data or the graph by pressing the graph button top right.
 There is the ability to show the graphs by default when a user visits the view.
Edit the view and click on the “properties and options” of the view. Simply tick the “Show Charts by default” options
There is the ability to show the graphs by default when a user visits the view.
Edit the view and click on the “properties and options” of the view. Simply tick the “Show Charts by default” options
For information about embedding a graph on a record see {insert link here}}.
(video coming soon}
Sparkline / Activity Histogram
These are mini little graphs that you can set to appear next to each record in a view. With sparklines next to every record on screen, you can quickly get an idea of the relative activity of each.
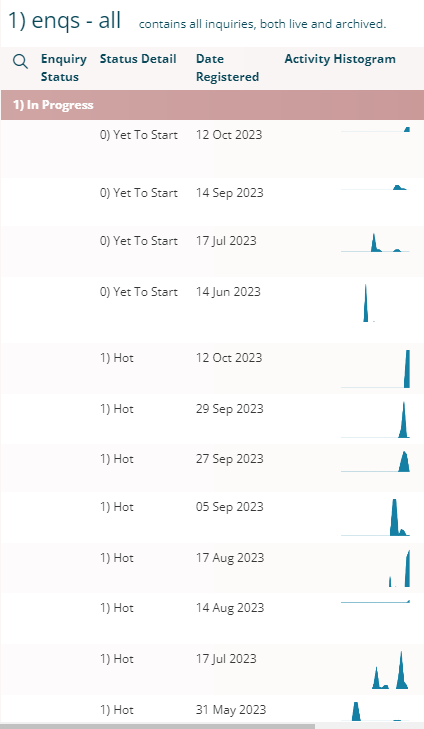
They are added to the view like any other field - simply choose “Activity histogram [auto]” from the dropdown list of fields for the appropriate table.
(video coming soon)
Feedback
Was this page helpful?
Glad to hear it! Please tell us how we can improve.
Sorry to hear that. Please tell us how we can improve.